
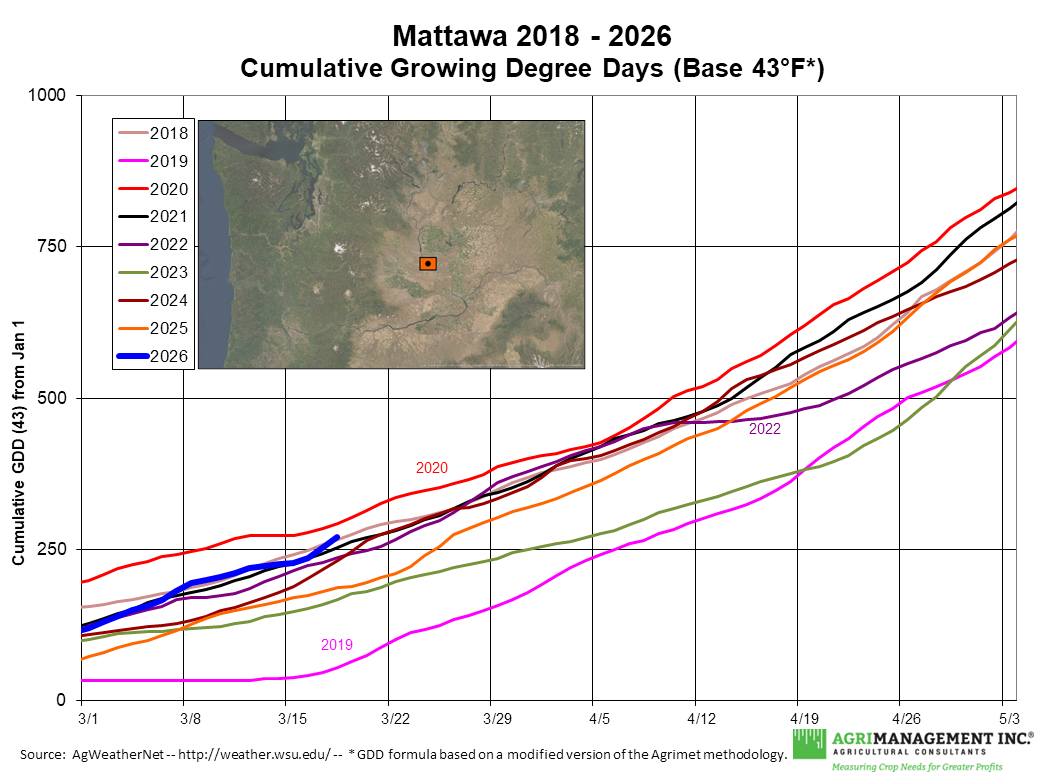
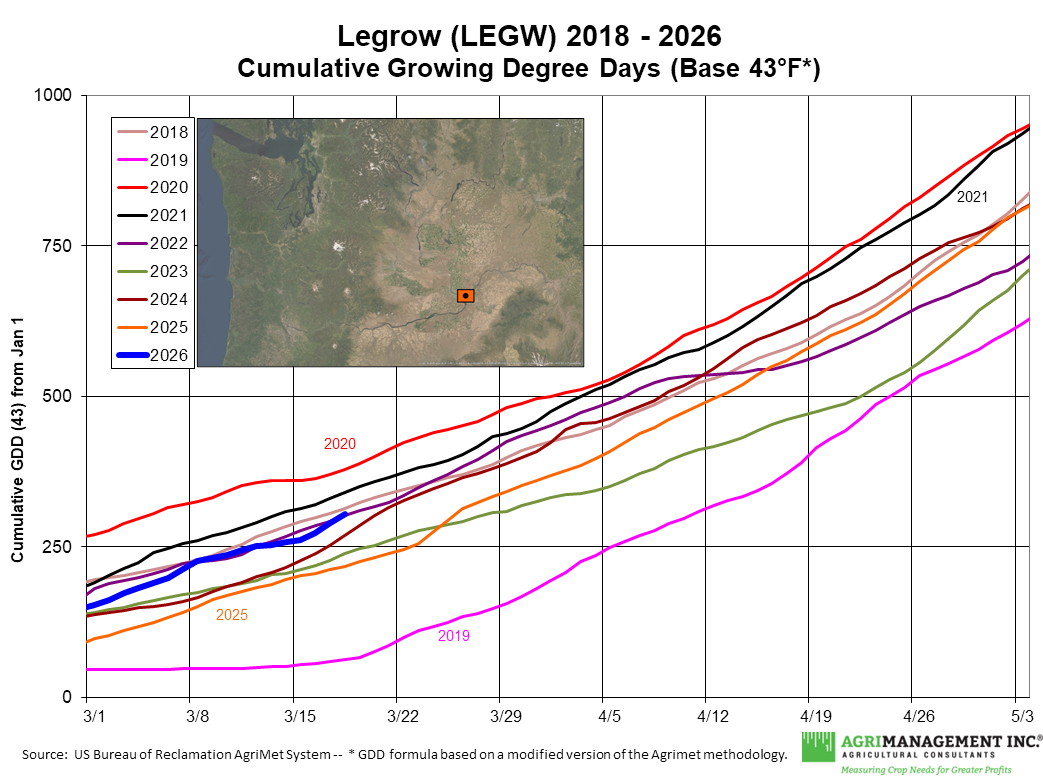
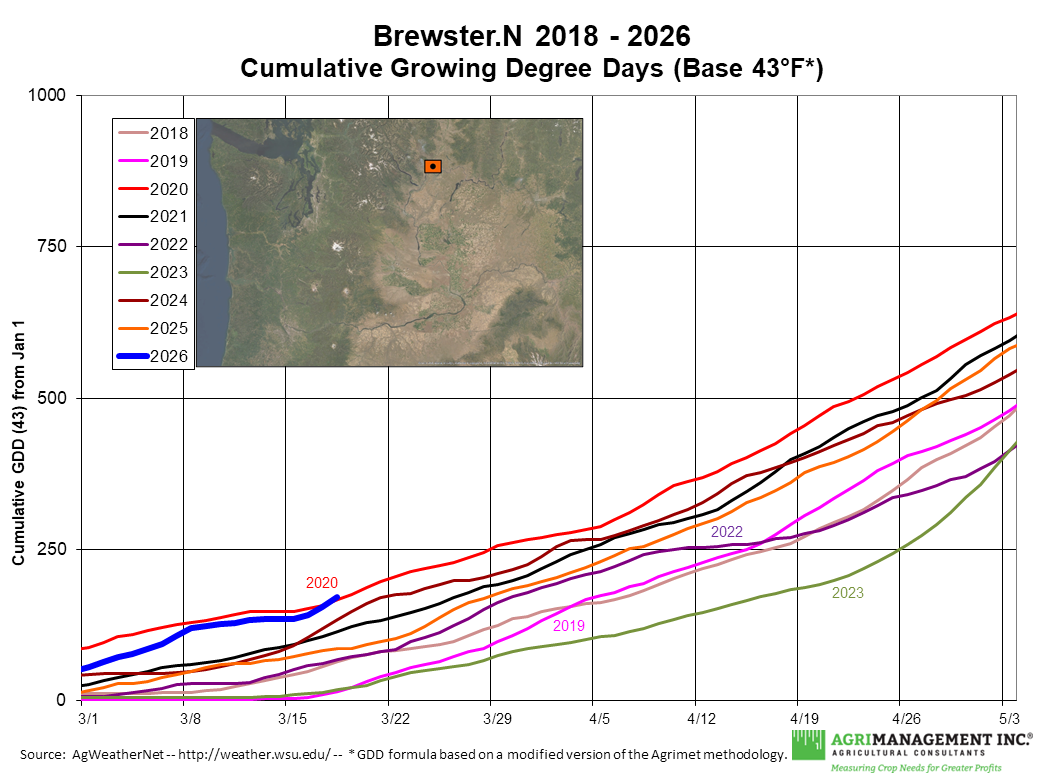
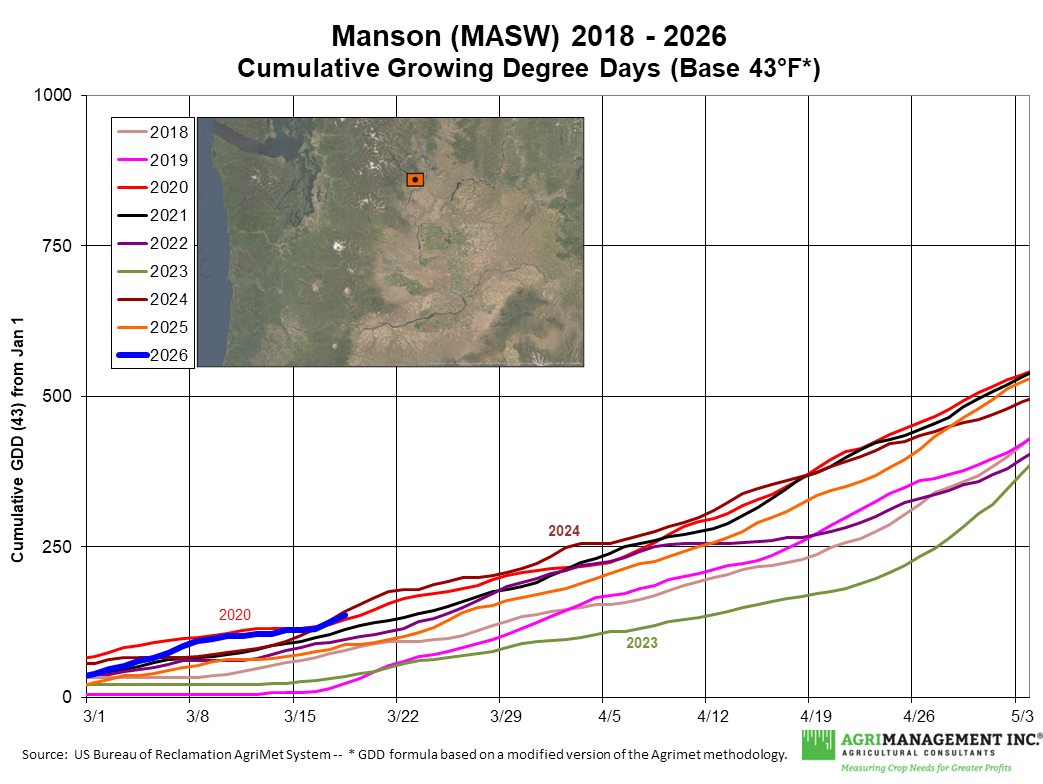
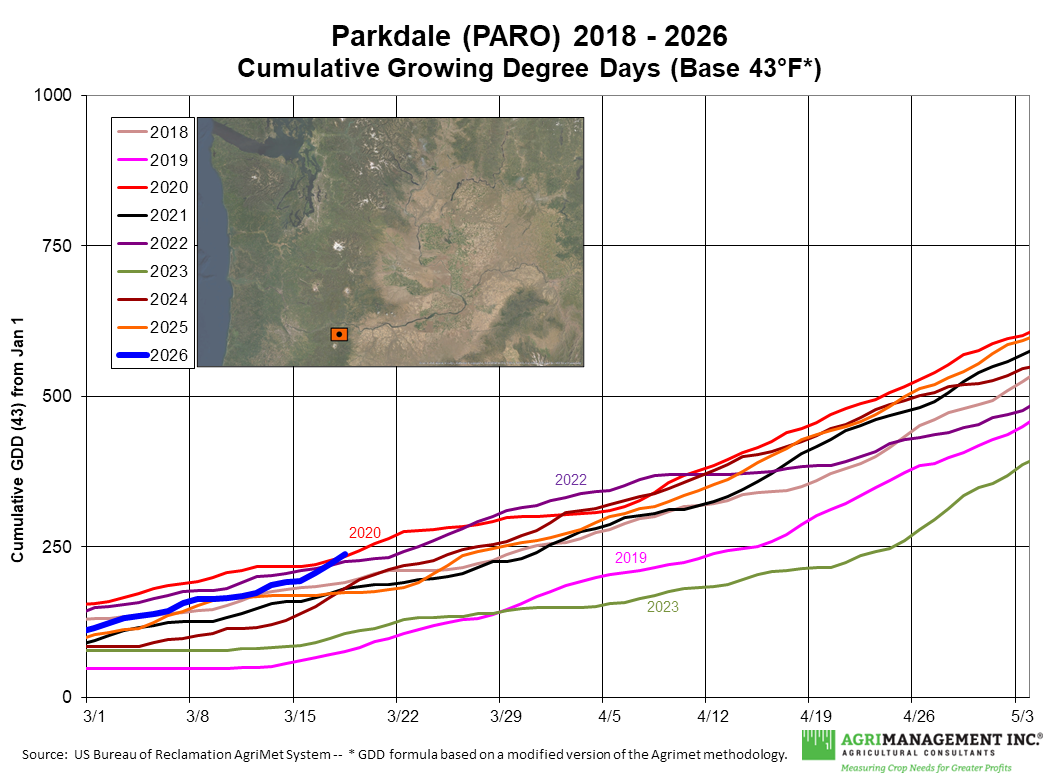
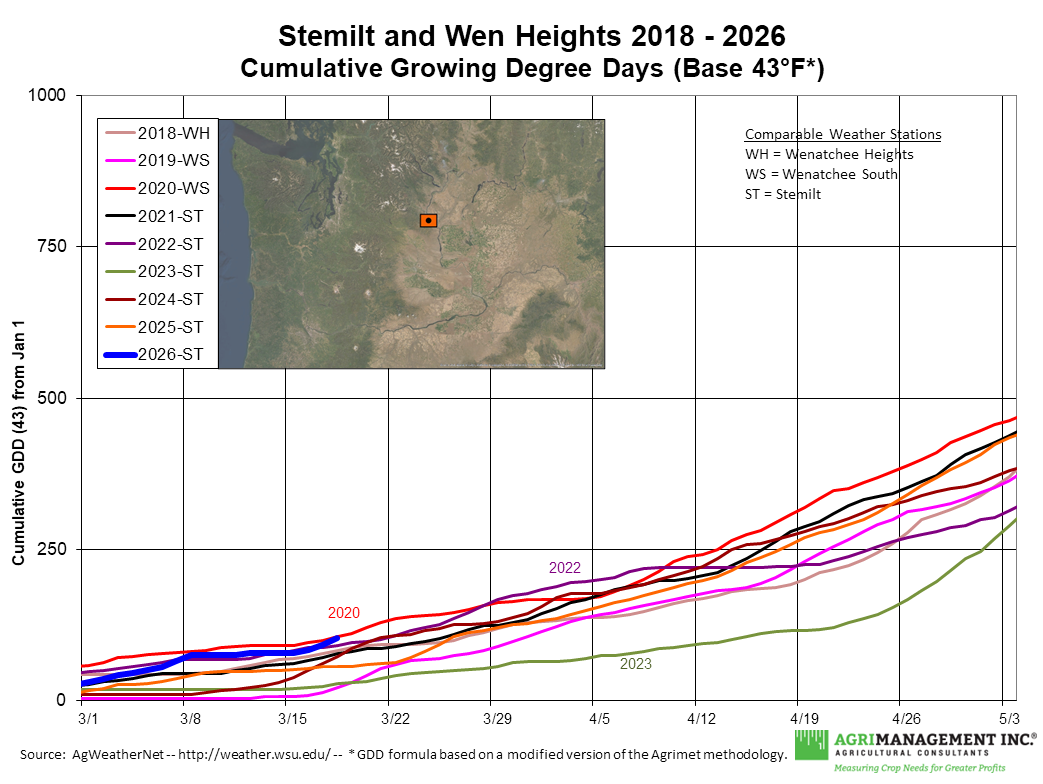
Cumulative Growing Degree Days, Base 43/86
Print this pageClick on the station names below for historical charts. Last updated on July 27, 2026.
| Station | PNG/GIF | Region | 07/26/26 | 07/26/25 | Normal '21-'25 | Source |
|---|---|---|---|---|---|---|
| MATT | Mattawa | 3062.8 | 2907.6 | 2824.6 | AgWeatherNet | |
| LEGW | Tri-Cities | 2968.8 | 2864.0 | 2853.5 | Agrimet | |
| HRMO | Hermiston | 2967.5 | 2892.9 | 2840.5 | Agrimet | |
| HRHW | Harrah | 2825.0 | 2665.7 | 2654.9 | Agrimet | |
| BF | Brewster.N | 2757.0 | 2545.7 | 2459.6 | AgWeatherNet | |
| MASW | Chelan | 2469.5 | 2375.1 | 2272.7 | Agrimet | |
| PARO | Parkdale | 2176.6 | 2133.1 | 2014.6 | Agrimet | |
| STEM | Stemilt / Wenatchee Hts | 2146.3 | 2027.5 | 1930.4 | AgWeatherNet | |
| Flipbook | PNW | 0.0 | 0.0 | 0.0 | Audio Analysis (5/19/26) | |
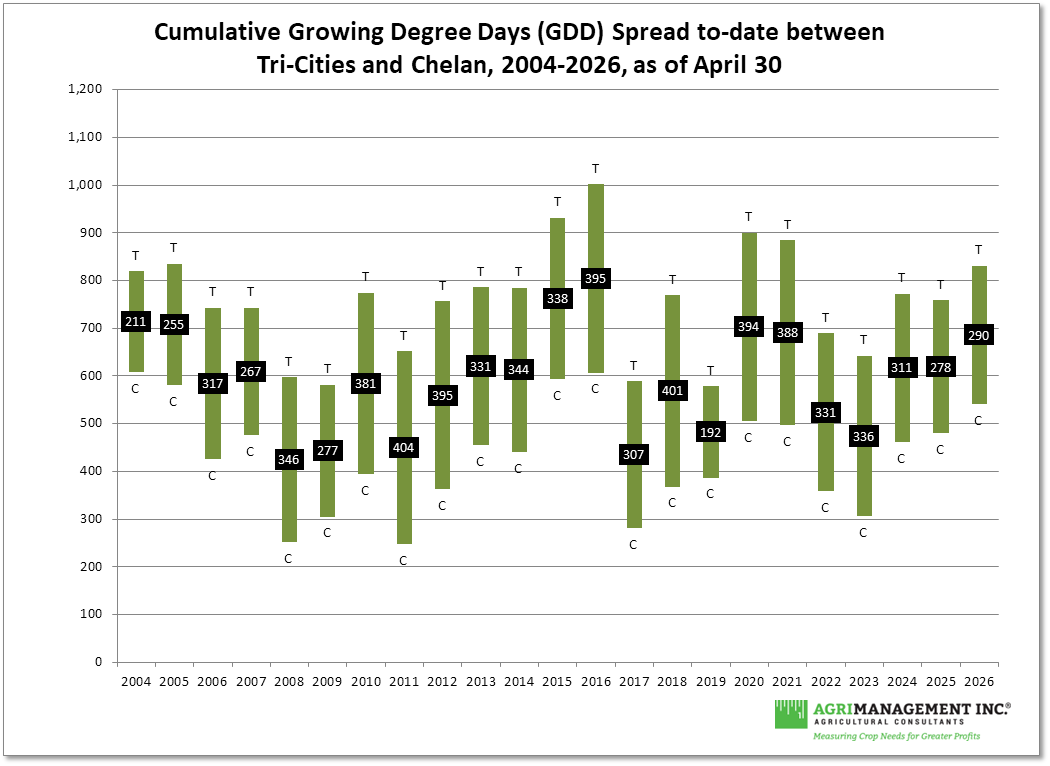
| Chelan-TriCities | Chelan-Tri-Cities Spread | 0.0 | 0.0 | 0.0 | Spread Analysis (early) [pdf] | |
| Parkdale-Harrah | Parkdale-Harrah Spread | 0.0 | 0.0 | 0.0 | Spread Analysis (late) [pdf] -- NEW! | |
| PNW Comparison | PNW | 0.0 | 0.0 | 0.0 | Spread Analysis (all) [pdf] |


Disclaimer: The purpose of these charts is to look at relative trends in terms of cumulative Growing Degree Days (GDDs) in Washington and Oregon, using a lower threshold of 43 degrees farenheit and an upper threshold of 86 degrees farenheit. While GDDs can be helpful in understanding the timing of natural (phenological) events for various crops or insects, these charts do not try to model those relationships. To better analyse or phenologically model a particular crop or insect, a different degree base may be appropriate.
Sources:
- Agrimet weather stations, Pacific Northwest Cooperative Agricultural Weather Network, Bureau of Reclamation, US Department of the Interior.
- AgWeatherNet stations, Washington Agricultural Weather Network, Washington State University.
- Integrated Fruit Production Network, Oregon State University.
- Charts assembled by Agrimanagement, Inc.